
Full Prometheus Monitoring Stack with docker-compose.
In this article, we will explore how to set up a full Prometheus monitoring stack using docker-compose. We will cover the configuration and deployment of Prometheus for metric collection, Grafana for data visualization, and Alertmanager for alert management. This guide is intended for those who are familiar with Docker and are looking to implement a robust monitoring solution for their applications and infrastructure.
This is an updated version which combines three previous articles of mine.
Prometheus
Prometheus Prometheus is an open-source monitoring and alerting toolkit that collects and stores metrics from various sources. It provides a powerful query language, PromQL, to analyze and visualize metrics. Prometheus is widely used for monitoring applications, infrastructure, and services. For example, your web app might expose a metric like:
http_server_requests_seconds_count{exception="None", method="GET",outcome="SUCCESS",status="200",uri="/actuator/health"} 435which means that the endpoint /actuator/health was successfully queried 435 times via a GET request. Prometheus can also create alerts if a metric exceeds a threshold, for example, if your endpoint returned more than one hundred times the status code 500 in the last 5 minutes.
Configuration
To set up Prometheus, we create three files:
prometheus/prometheus.yml — the actual Prometheus configuration
prometheus/alert.yml — alerts you want Prometheus to check
docker-compose.yml
Add the following to prometheus/prometheus.yml
global:
  scrape_interval: 30s
  scrape_timeout: 10s

rule_files:
  - alert.yml
scrape_configs:
  - job_name: services
    metrics_path: /metrics
    static_configs:
      - targets:
          - 'prometheus:9090'
          - 'idonotexists:564'
scrape_configs tell Prometheus where your applications are. Here we use static_configs hard-code some endpoints.
The first one is Prometheus (this is the service name in the docker-compose.yml) itself, the second one is for demonstration purposes. It is an endpoint that is always down.
rule_files tells Prometheus where to search for the alert rules. We come to this in a moment.
scrape_interval defines how often to check for new metric values.
If a scrape takes longer than scrape_timeout (e.g. slow network), Prometheus will cancel the scrape.
The alert.ymlfile contains rules which Prometheus evaluates periodically. Insert this into the file:
groups:
  - name: DemoAlerts
    rules:
      - alert: InstanceDown
        expr: up{job="services"} < 1
        for: 5m
up is a built-in metric from Prometheus. It returns zero if the services were not reachable in the last scrape.
{job="services"} filters the results of up to contain only metrics with the tag service. This tag is added to our metrics because we defined this as the job name in prometheus.yml
Finally, we want to launch Prometheus. Put this into your docker-compose.yml:
version: '3'
services:
  prometheus:
    image: prom/prometheus:v2.46.0
    ports:
      - 9000:9090
    volumes:
      - ./prometheus:/etc/prometheus
      - prometheus-data:/prometheus
    command: --web.enable-lifecycle  --config.file=/etc/prometheus/prometheus.yml

volumes:
  prometheus-data:
The volume ./prometheus:/etc/prometheus mounts our prometheus folder in the right place for the image to pick up our configuration.
prometheus-data:/prometheus is used to store the scraped data so that they are available after a restart.If you use --web.enable-lifecycle you can reload configuration files (e.g. rules) without restarting Prometheus:
curl -X POST http://localhost:9000/-/reloadIf you modify the command, you will override the image’s default settings, so you must explicitly include the --config.file=... option.
Start Prometheus.
Finally, start Prometheus with:
docker-compose up -dand open
http://localhost:9000
in your browser.

You’ll see Prometheus UI where you can enter some ad-hoc queries on your metrics, like up:

As expected, this tells you that your Prometheus is up, and the other service is not.
If you go to Alerts you'll see that our alert is pending (or already firing):

Grafana
Grafana is a powerful open-source platform for monitoring and observability that allows you to create, explore, and share dashboards with your team. It supports various data sources, including Prometheus, and provides a wide range of visualization options.
Configuration
Grafana can work without any configuration files. However, to streamline the setup process, we will configure Prometheus as a data source using a configuration file. Create the file grafana/provisioning/datasources/prometheus_ds.yml and add the following content:
datasources:
  - name: Prometheus
    access: proxy
    type: prometheus
    url: http://prometheus:9090
    isDefault: true
This configuration file tells Grafana about the Prometheus data source. The url field specifies the address of the Prometheus server, which is reachable at
http://prometheus:9090
within the Docker network.
Next, update the docker-compose.yml file to include the Grafana service:
  grafana:
    image: grafana/grafana:10.0.0
    ports:
      - 3000:3000
    restart: unless-stopped
    volumes:
      - grafana-data:/var/lib/grafana
      - ./grafana/provisioning:/etc/grafana/provisioning

volumes:

  grafana-data:
The first volume mounts our data source configuration in the appropriate location for Grafana to pick it up. The second volume is used to persist Grafana’s data, such as dashboards and user settings.
Start Prometheus and Grafana:
docker-compose up -dOpen
http://localhost:3000
in your browser and log in with the default credentials admin for both the username and password.
You should see the Grafana Landing Page after login:

Add the first dashboard

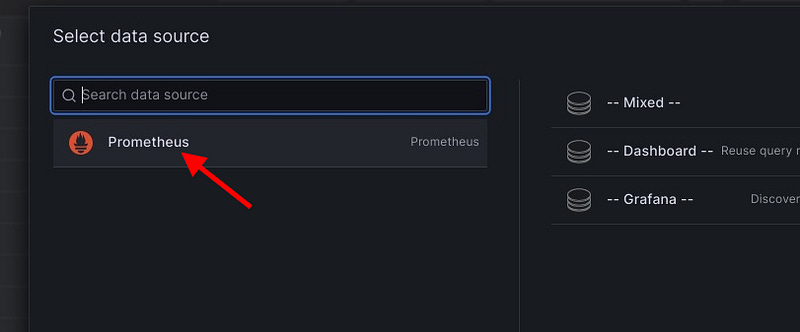
After logging in, you can create a new dashboard by clicking on the “+” icon on the top right and selecting “New Dashboard.” Click on “Add visualization” to create your first visualization.
Select the Prometheus datasource.You can select Prometheus here because we added the configuration earlier.
You can now enter PromQL queries to visualize your metrics. For example, enter the following query to display the total number of HTTP requests over time:
increase(prometheus_http_requests_total[1m])To learn more about PromQL, see the official documentation.

Click on Apply to save and go back to the dashboard. Finally, click on the dashboard save button in the upper right corner.
Grafana also allows you to import pre-made dashboards. Visit the Grafana Dashboards page to find a wide range of community-contributed dashboards for various data sources and use cases. Simply enter the dashboard ID or upload the JSON file to import it into your Grafana instance.
Alertmanager
Alertmanager is an open-source tool that handles alerts sent by Prometheus. It takes care of deduplicating, grouping, and routing alerts to the appropriate receiver, such as email, Slack, or PagerDuty. Alertmanager also allows you to silence and inhibit alerts.Configuration
You can get all source code from GitHub. Check out the tag `part-2-grafana` if you want to follow along.
Configuration
First of all, add Alertmanager and a volume to docker-compose.yml:
  alertmanager:
    image: prom/alertmanager:v0.25.0
    ports:
      - 9093:9093
    volumes:
      - ./alertmanager:/config
      - alertmanager-data:/data
    command: --config.file=/config/alertmanager/alertmanager.yml

volumes:
  alertmanager-data:
Alertmanager will persist silence configurations to the volume.
The next configuration contains information about which channels to send to. For simplicity, we use e-mail. Refer to the Alertmanager docs to learn about other channels.
Create a folder alertmanager and add a file alertmanager.yml to it:
receivers:
  - name: 'mail'
    email_configs:
      - smarthost: 'smtp.gmail.com:587'
        from: 'your_mail@gmail.com'
        to: 'some_mail@gmail.com'
        auth_username: '...'
        auth_password: '...'
The route section configures which alerts will be sent. In our case, we sent all alerts. You could add more routes and filter, for example, on alert tags (see the example in the docs.).
receivers configures our target channels. Note how route refers to the receiver mail on line two. You will get a new mail every four hours until the problem is solved.
Finally, we need to tell Prometheus about the Alertmanager. Open prometheus/prometheus.yml and add the following:
alerting:
  alertmanagers:
    - static_configs:
        - targets:
            - 'alertmanager:9093'
Testing
Run docker-compose up.
Open http://localhost:9093 in your browser to see the Alertmanager UI.

After a couple of minutes, the test alert fires. You can check this in your Prometheus instance.

Now, you can see the alert in the Alertmanager as well:

Check your inbox for the notification:

Using Alertmanager
In the Alertmanager UI, you can view active and silenced alerts, manage notification receivers, and configure alert routing. You can also create and manage silences to suppress alerts during maintenance windows or planned outages.
To silence an alert, go to the “Silences” tab and click on “New Silence.” Select the affected alert, set the start and end times for the silence, and provide a comment. Click on “Create” to activate the silence.
Conclusion
In conclusion, the Prometheus monitoring stack provides a comprehensive solution for monitoring applications and infrastructure. By using docker-compose, we can easily deploy and manage the components of the stack, including Prometheus, Grafana, and Alertmanager. This setup allows us to collect metrics, visualize data, and manage alerts effectively. Whether you are monitoring a small application or a large-scale infrastructure, this stack offers a powerful and flexible monitoring solution.